

1.安装
1.1docker 方式安装
https://grafana.com/docs/grafana/latest/installation/docker/
docker run -d -p 3000:3000 grafana/grafana # 最新版本
在granfana 容器里安装插件
docker run -d \
-p 3000:3000 \
--name=grafana \
-e "GF_INSTALL_PLUGINS=grafana-clock-panel,grafana-simple-json-datasource" \
grafana/grafana
1.2 yum 安装
# vim /etc/yum.repo.d/grafana.repo
[grafana]
name=grafana
baseurl=https://packages.grafana.com/oss/rpm
repo_gpgcheck=1
enabled=1
gpgcheck=1
gpgkey=https://packages.grafana.com/gpg.key
sslverify=1
sslcacert=/etc/pki/tls/certs/ca-bundle.crt
`
yum clean all
yum makecache
yum install grafana
1.3手动安装 (推荐)
# https://grafana.com/grafana/download?platform=linux
wget https://dl.grafana.com/oss/release/grafana-7.1.0-1.x86_64.rpm
yum install grafana-7.1.0-1.x86_64.rpm
2.启动服务
systemctl daemon-reload
systemctl start grafana-server
systemctl status grafana-server
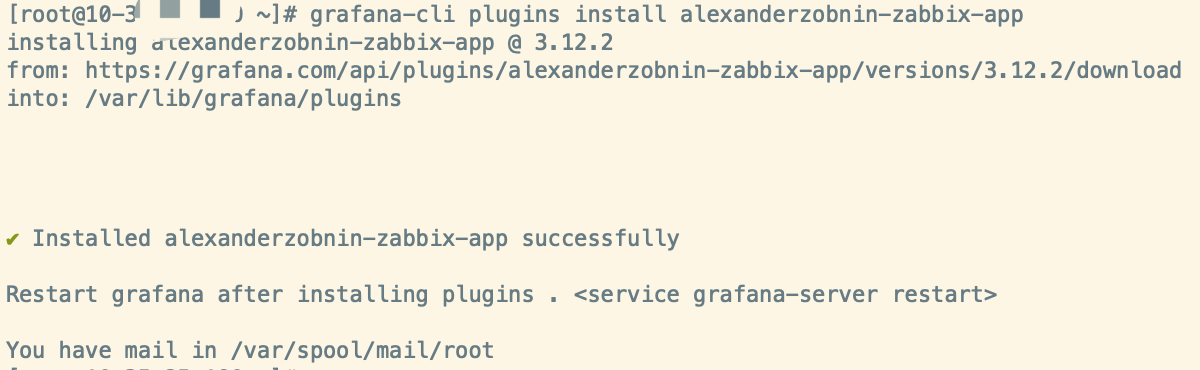
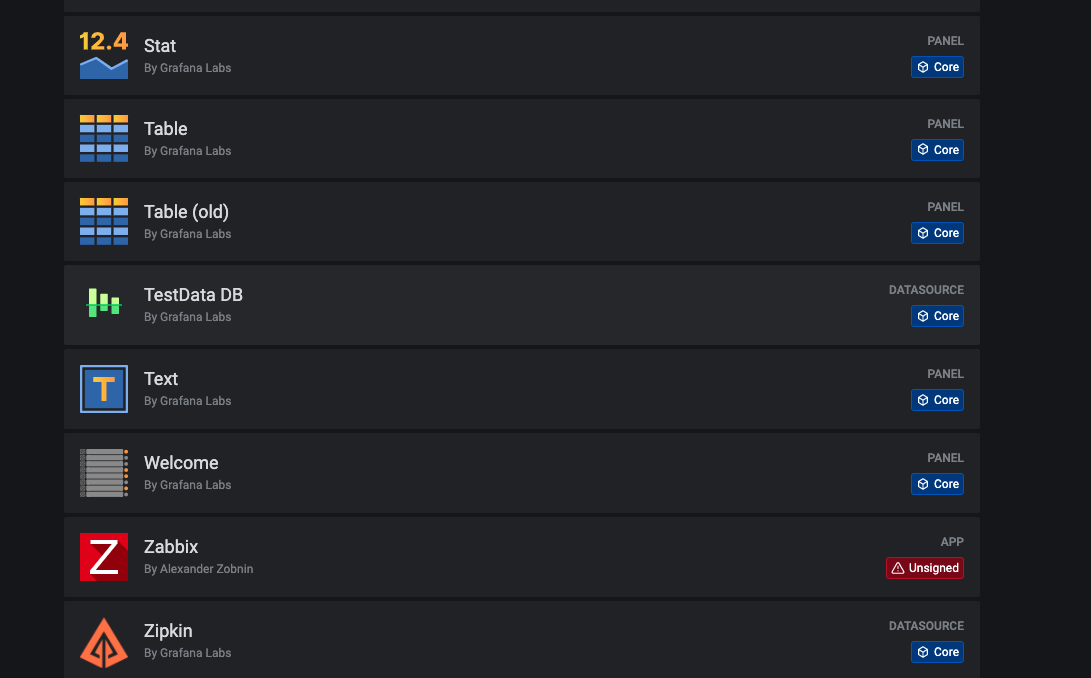
3.安装插件
grafana-cli plugins install alexanderzobnin-zabbix-app
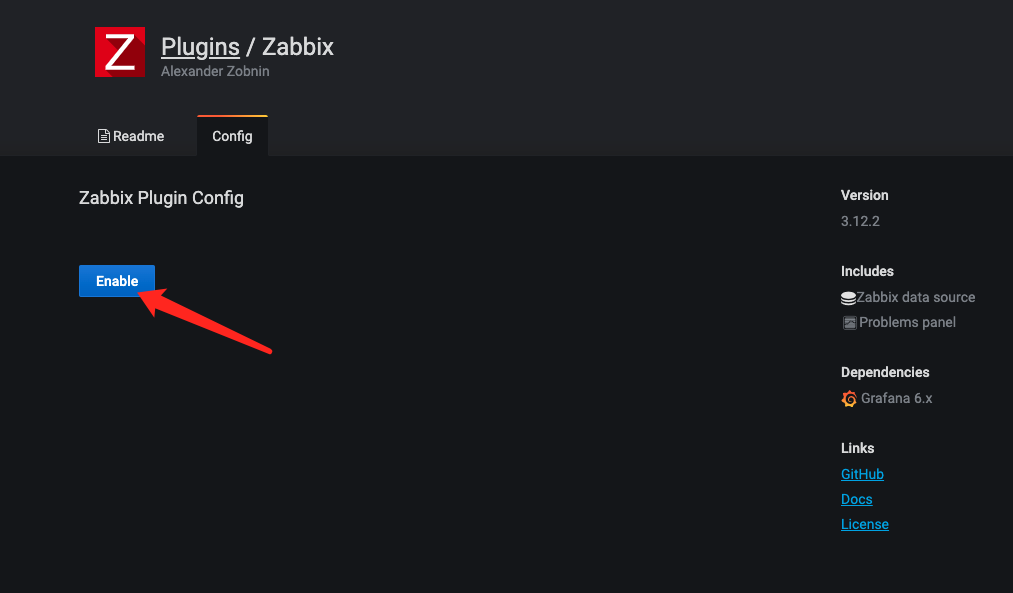
 Enable it
# 重启服务
 systemctl restart grafana-server
添加 datasource zabbix
http://jaminzhang.github.io/monitoring/Zabbix-API-Intro-and-Usage/
使用 API 的基本步骤
    1.连接 http://x.x.x.x/api_jsonrpc.php 提供用户名和密码,
    2.并标识 HTTP 头部 Content-Type:application/json,HTTP 方法为 POST。
    3.获取 SESSIONID
    3.通过 SESSIONID 建立后续的连接
    4.提交 POST 数据,格式为 JSON,其中放对应的方法,获取需要的数据。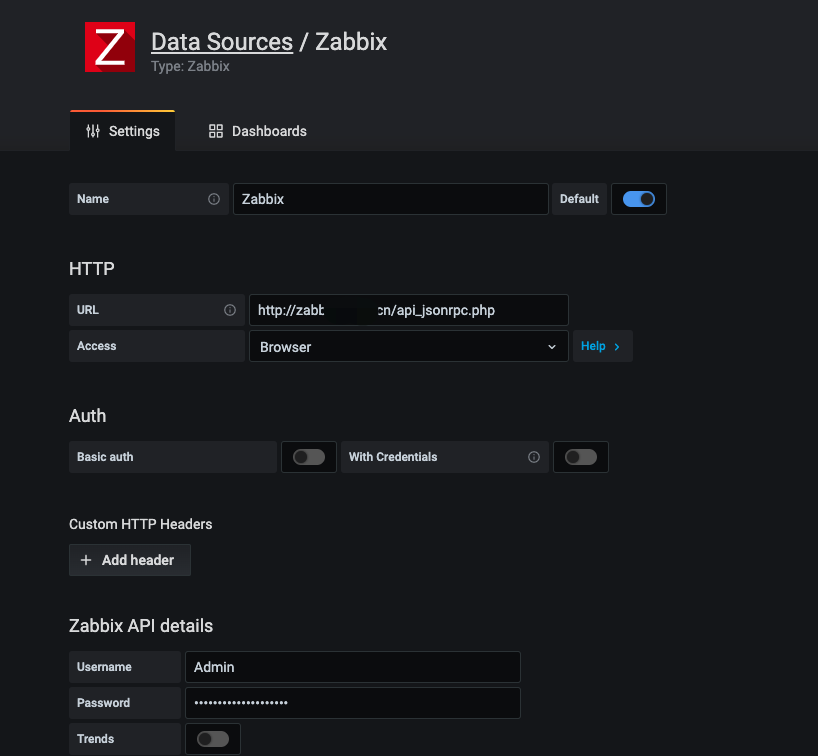
官方插件:
https://grafana.com/grafana/plugins?utm_source=grafana_plugin_list